Playing time by plan.
Minutes are counted from the match reports, for every player, position and month, and compared with the rest of the squad. You see in time who is falling behind.
0103
The whole squad in one table
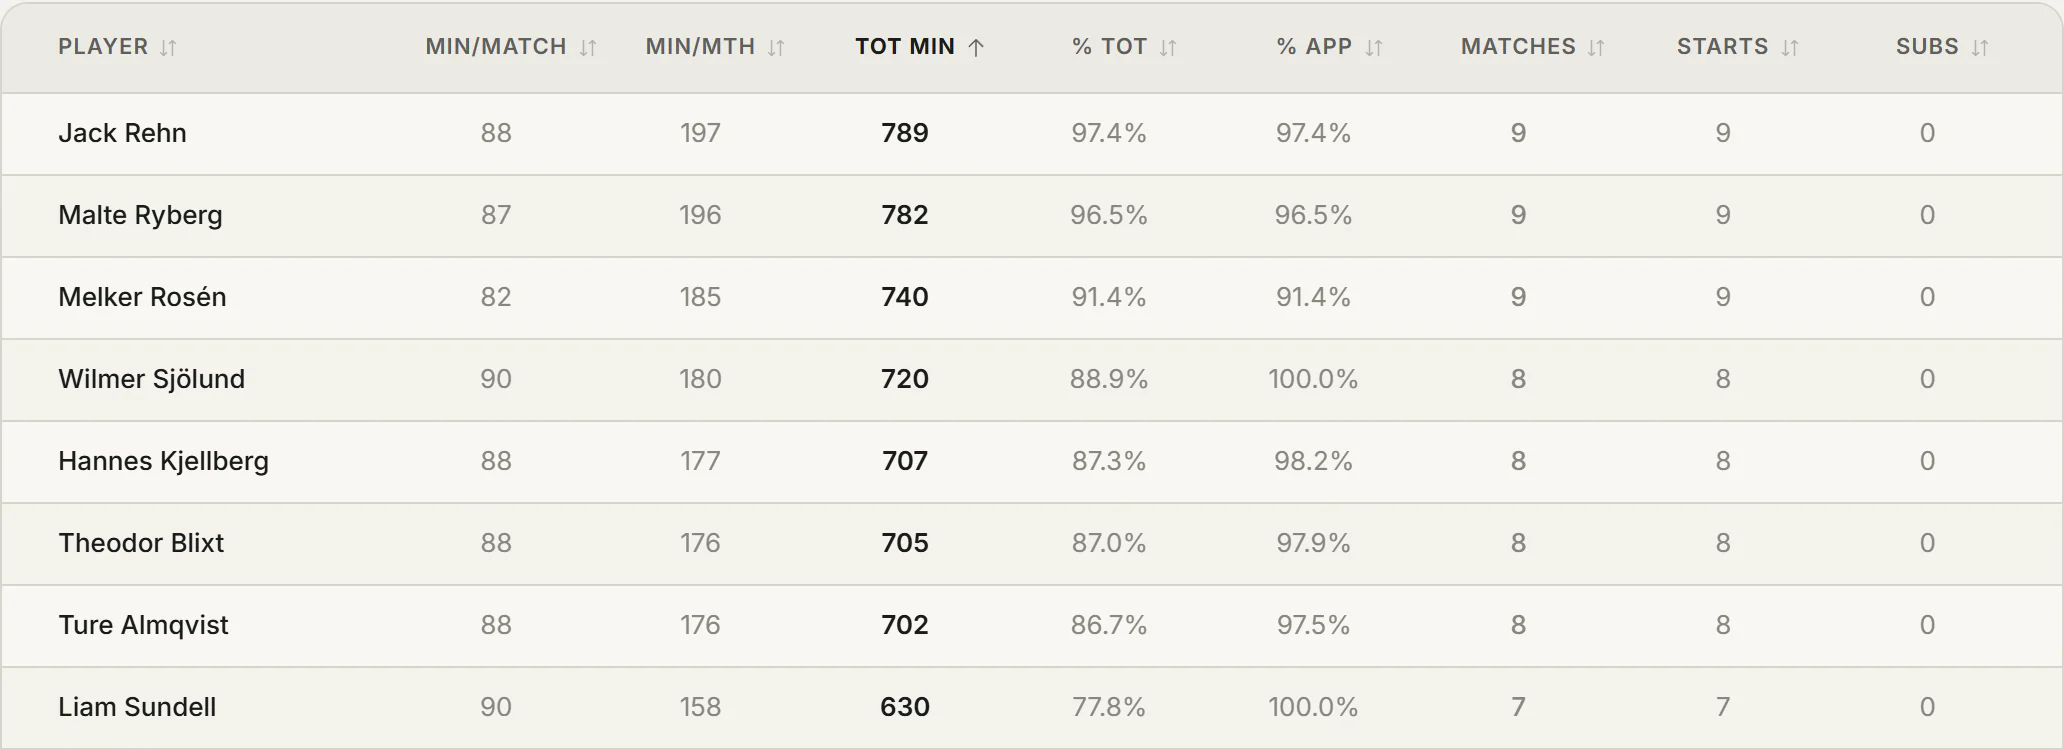
The table shows minutes, matches and averages for every player over the season. Sort by any column and compare the players in the team.
0203
Minutes against age
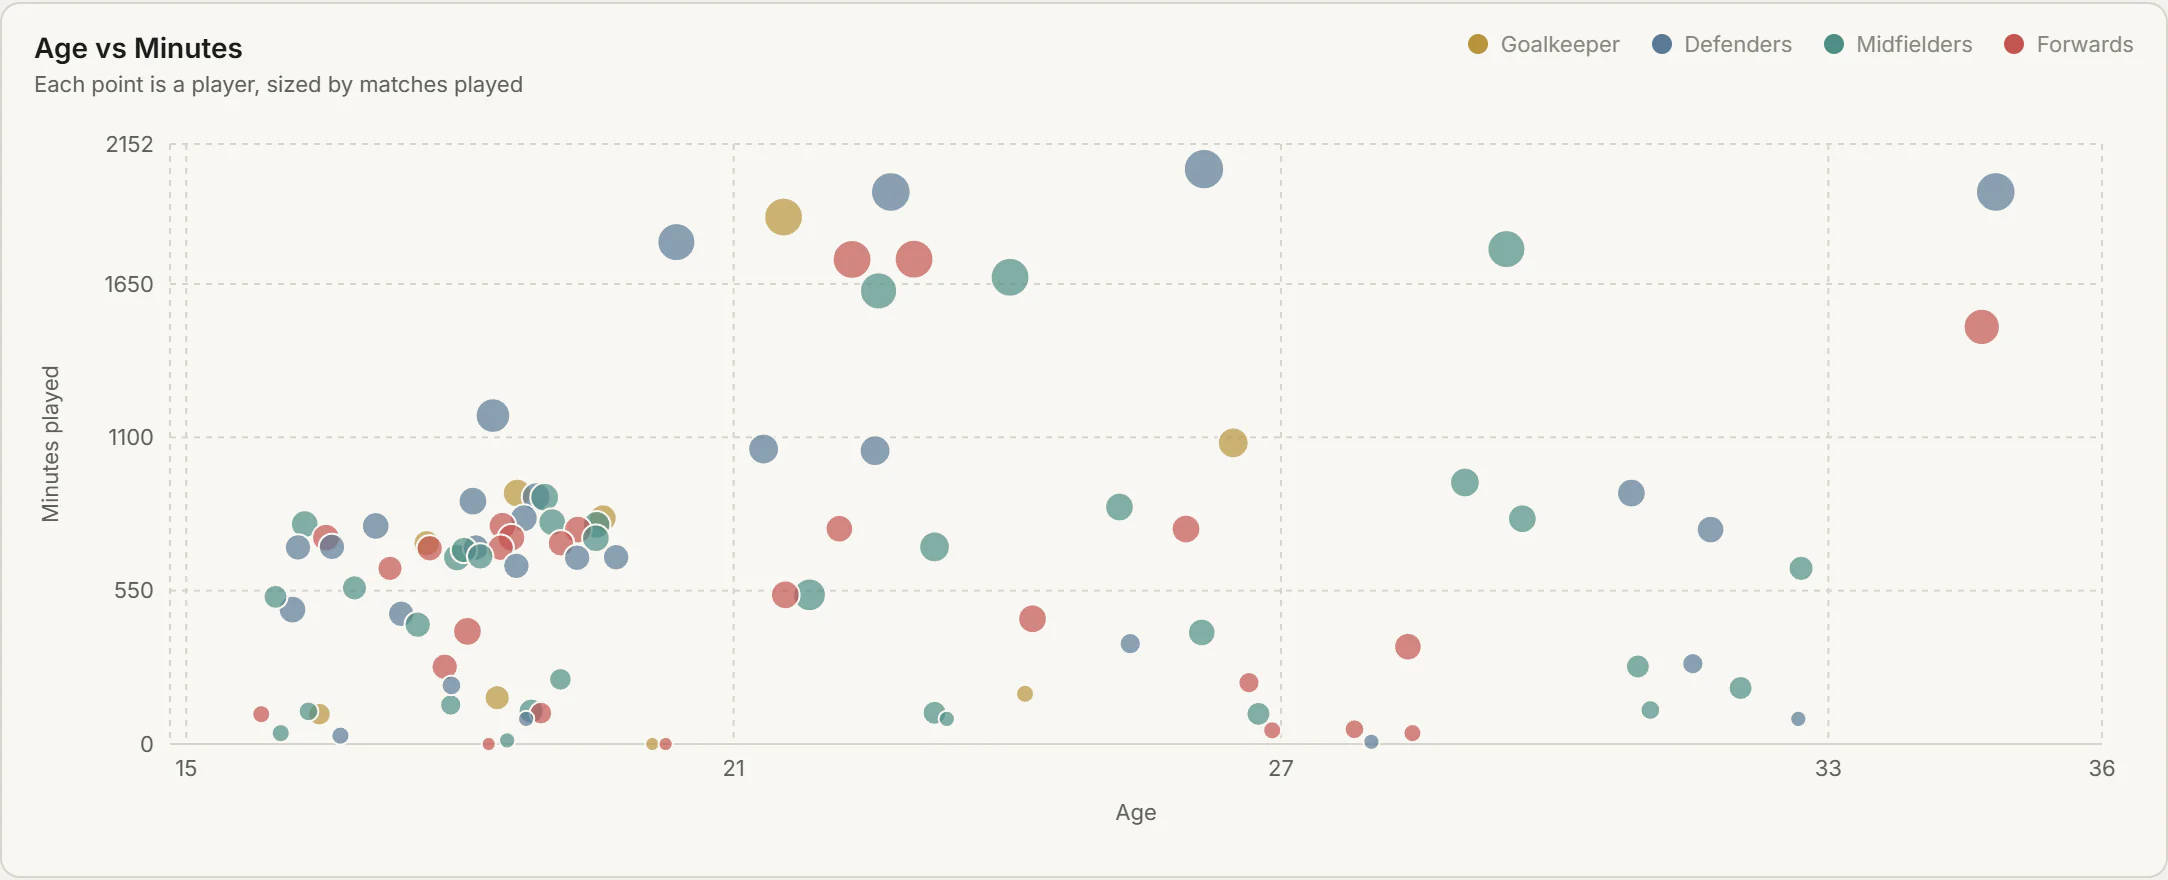
The chart plots every player’s minutes against their age, so you see whether the young players get the time they need.
0303
By position and month
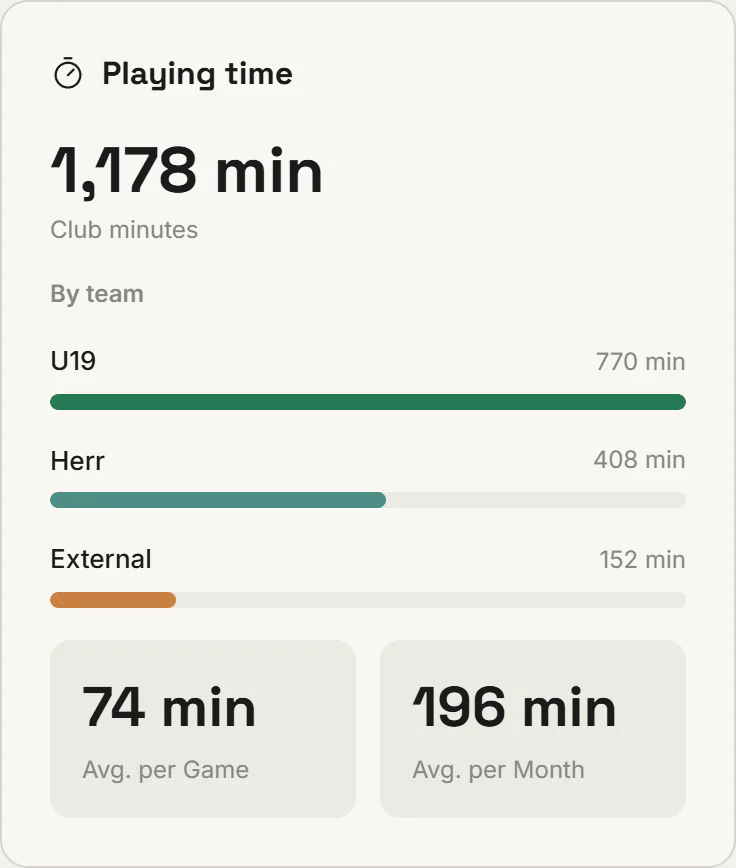
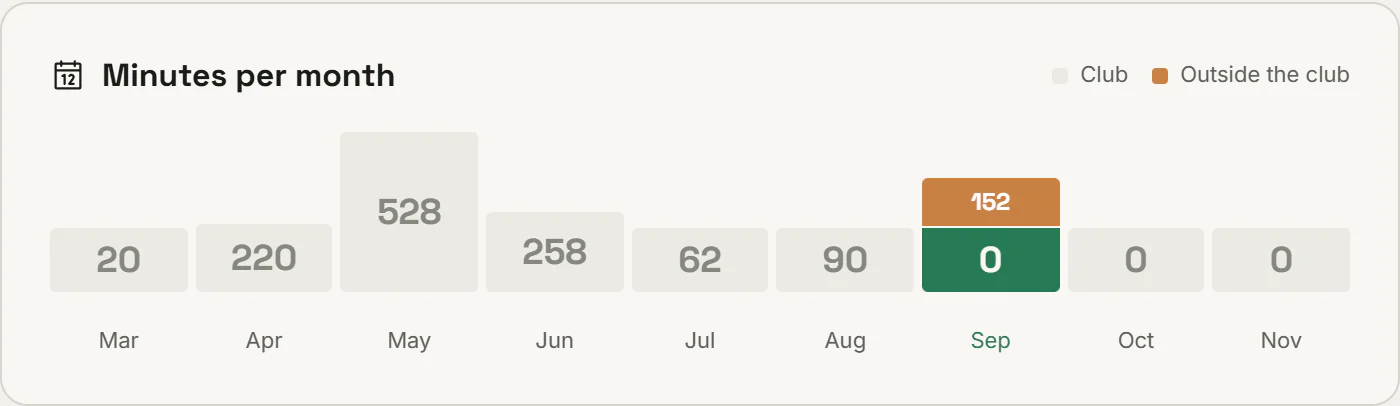
See where a player got their minutes, for which team and in which position, and how they spread over the season, national team and loans included. Solid input for the development talk.
Three questions. Three answers.
- 01
Who is short on minutes?
The table and the chart show who sits below the squad average.
- 02
Are our young players getting enough minutes?
The chart of minutes against age shows it for the whole squad at once.
- 03
Where has the player played this year?
Every player’s profile shows their minutes by position and month.
Same data. More answers.

See ClubFlow in action.
Book a walkthrough for the academy, the first team or both. We show you what matters for your club.
- We get back to you shortly to find a time
- We set up the club together with you
- The club owns all data and can export it at any time